Infrastructure monitoring has evolved into what we now call observability. Observability is built around three core signal types, although additional signals can provide even deeper insight into how applications and systems behave. These three primary signals offer a black-box perspective into your infrastructure’s inner workings. They include:
- Logs: Time-stamped records that capture specific events or actions within an application.
- Metrics: Quantitative representations that summarize data points into understandable values.
- Traces: End-to-end records that map the journey of a request, highlighting its duration and key telemetry data.
In this article, our focus will be on metrics—specifically, how to effectively manage and store them for long-term use.
Among open-source tools used in Kubernetes environments for handling metrics, Prometheus is the most widely adopted. Let’s briefly explore what Prometheus is.
What is Prometheus?
Prometheus is a metrics collection, analysis, and storage engine for operating systems and applications running in a Kubernetes cluster or a single operating system. It also has a robust alerting feature that can be used to fire up alerts based on certain expressions on PromQL (query language, which is the official analytics language used in Prometheus).
Now that we have the basic idea of what Prometheus is, let us break down some of the components that make up Prometheus and understand the basics of its inner workings. For more in-depth understanding of Prometheus, you can read our introductory article here.
What is the Problem with Managing Metrics ?
When you deploy Prometheus for the first time in Kubernetes, use the helm charts default. Everything looks good from the onset. You can see your Prometheus metrics browser on port 9090. This allows you to view the data stored in the default TSDB database engine that comes default with Prometheus.
Unfortunately, this setup does not apply to a multi-deployment environment, and a situation or old metrics might be relevant for analysis, audit, and performance management. The two challenges from this basic setup are:
- Durability, Scalability, and backup of the TSDB data.
- TSDB storage for Prometheus only keeps Metrics for 15 days by default. Well, you could say you can increase the retention period configuration with the flag –storage.tsdb.retention.time=1y. This also does not solve the second problem, which is;
- Deploying multiple Prometheus query dashboards or Grafana dashboards/instances for every Prometheus Deployment.
These three challenges mentioned above can be solved in three different ways. They are;
What Solutions Exist?
Three options shall be listed and explained. One of the three will be highly recommended because it is the most scalable method to implement.
The three solutions are as follows:
- Thanos + Prometheus + Object Storage
- Mimir + Prometheus + Object Storage
- AMP (Amazon Managed Prometheus) + Prometheus
Each deployment method has its own strengths and weaknesses. However, Prometheus remains the common component across all setups, serving as the primary tool for scraping and initially storing metric data.
Thanos + Prometheus + Object Storage
In this setup, two other components are combined with the original Prometheus setup: Thanos and Objectstore (S3, Minio, GCS, Azure Blob, etc).
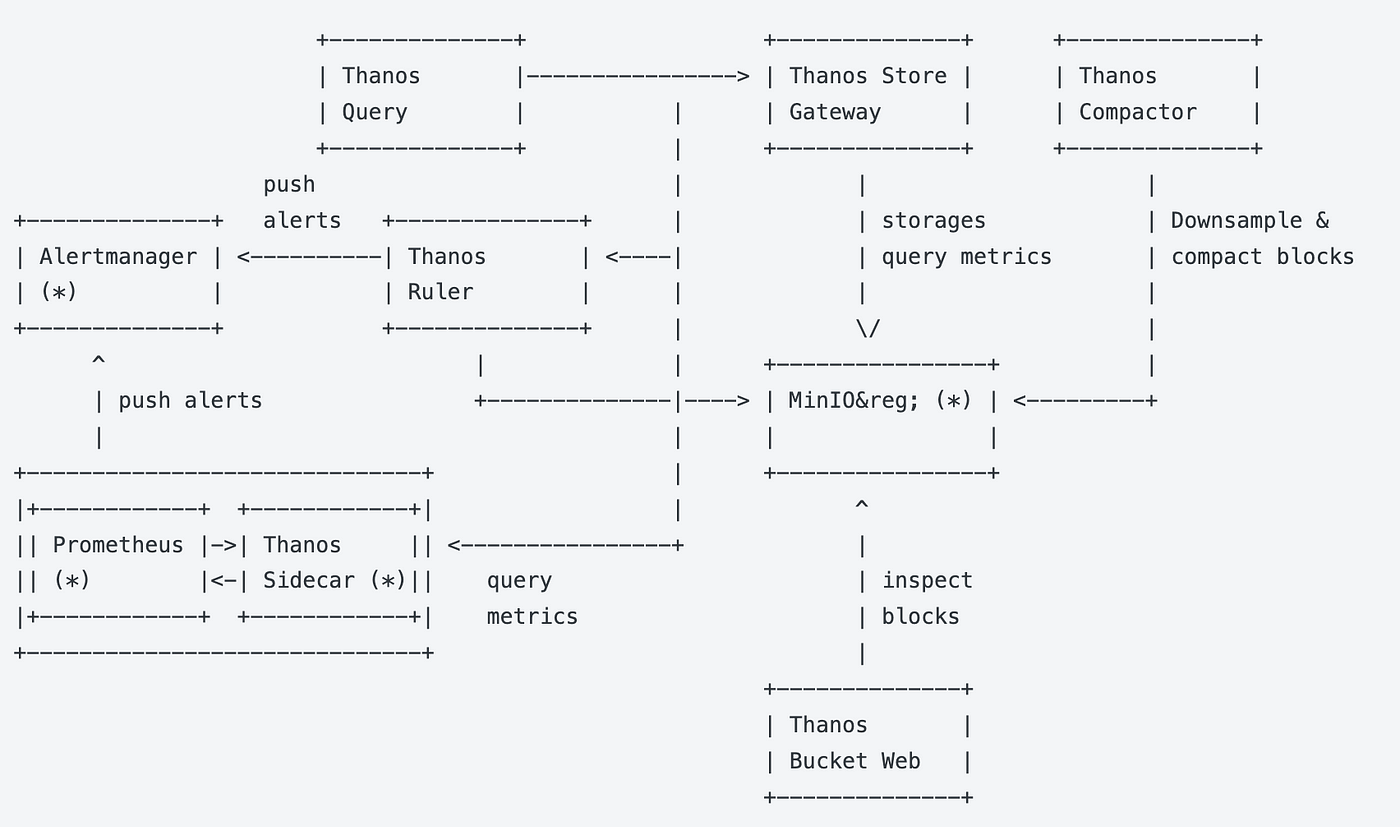
Thanos is an Open-source Prometheus-like tool that enables you to store metrics long-term in an object storage engine. It does this by running as a sidecar in a Prometheus deployment to copy metric data into the object storage engine. It keeps the data in partitions in the object storage, making it more efficient to read from whenever a query is run. So the typical architecture is for Prometheus to scrape the metrics and store them in TSD. Then, Thanos picks these metrics and writes them to the object store. Thanos also has a query UI which is identical to Prometheus query, and interestingly takes PromQL also. This means no new query language to learn and the same consistent UI with Prometheus.

It also integrates seamlessly with Grafana. When configuring the data source in Grafana, the option to choose is Prometheus and the URL to the Thanos that has been deployed. The full Thanos setup guide on Amazon EKS can be found here. You can also read more about Thanos from the official website here. Let us outline some fundamental characteristics of this setup:
Basic Characteristics
- No changes to the Prometheus configuration
- Thanos seats next to Prometheus, thereby reducing latency
- Integrates easily with Grafana as it is read as Prometheus
- Has an identical UI to Prometheus, only this time, the logo is Thanos.
- Thanos uses a pull mechanism to extract and write data to the storage engine.
With this method of deployment, one Prometheus setup can sit on Staging and Production clusters, and have a Thanos sidecar on both, sending metrics to a single storage engine. The metrics can be separated from Grafana based on the unique environment labels. This aggregates and unifies data from both environments into a single source of truth: the object storage engine. Which is where Thanos will query from when data is needed.
The next method is:
Mimir + Prometheus + Object Storage

Similar to the first method described, a different tool comes from the stables of the LGTM (Loki, Grafana, Tempo, Mimir) stack.
Mimir is designed to be the long-storage engine brother of Prometheus. It does not collect metrics or seats beside Prometheus as a sidecar like Thanos. A remote_write configuration entry needs to be added for Prometheus to send metric data to the Mimir storage engine.
Mimir has various storage mechanisms. You can either store data in its internal storage engine, which will use block storage for the data, or you can configure an object storage (like Amazon S3) to store metrics data.
Mimir, being part of the Grafana family, has seamless integration with Grafana and still uses the Prometheus data source. But it is recognized by Grafana as Mimir.
PromQL is also supported in Mimir. This means, the same queries that are used for Prometheus can also be used on Mimir, and the same results will be achieved. So, no new queries are to be learned when using Mimir to query data. Here are some key characteristics of Mimir to be noted.
Basic Characteristics
- Modifications need to be made to the Prometheus configuration for Prometheus to write to the Mimir endpoint.
- Mimir does not run as a sidecar of Prometheus, but as an independent service that can either be deployed within Kubernetes or as a single binary.
- Integrates easily with Grafana.
- Prometheus uses a push mechanism to send metrics to Mimir
Mimir setup also solves the multi-environment problem; all metrics from all environments can be sent directly to the Mimir instance via the Prometheus running in both staging and production, or as many environments deployed. There is a full article here that describes Mimir and how to set it up.
The last on the list is AMP integration with Prometheus, which is a Managed Prometheus service from AWS.
AMP (Amazon Managed Prometheus) + Prometheus
Every other scenario mentioned above sends metrics to a non-native Prometheus service. In this scenario, metrics will be sent directly from one Prometheus to another Prometheus instance. What makes this scenario unique is that the metrics are sent to a Managed Prometheus service. This means that Prometheus is highly available, scalable, and secure. This is Amazon Managed Service for Prometheus. This is running Prometheus on steroids. All the issues of running your own Prometheus instance are handled, with a properly configured AMP.
In this scenario, only two things need to be set up: Prometheus in the source environment where metrics need to be collected, and AMP, which is the destination for the metrics. Similar to Mimir, a remote_write needs to be configured on Prometheus to point to AMP and send metrics there.
Basic Characteristics
- Modifications need to be made to the Prometheus configuration for Prometheus to write to the AMP endpoint.
- AMP does not run as a sidecar of Prometheus but as a managed service in AWS.
- Integrates easily with Grafana.
- Prometheus uses a push mechanism to send metrics to AMP.
AMP is highly recommended because it is managed, and you do not have to manage anything when using it. Just like Thanos and Mimir, it also solves multi-environment deployments, allowing AMP to be the single destination for all metrics.
Conclusion
Other solutions can be used to store long-term metrics from Prometheus; the following link shows a list of them. Three different approaches to doing that have been discussed in this article: Thanos, Mimir, and AMP are three different and efficient solutions that can deliver that. Ideally, the best to go with will be AMP because of its reliability, scalability, and security features.


