When the idea of a software product is conceived, the initial plans for how the application will work are laid out, including Product Design diagrams and workflows. Then developers write down the code, which gets deployed into a virtual machine for a basic setup or a complex container orchestration system such as Kubernetes. However, after the application is deployed, developers still need to understand how it performs or behaves over time as it runs in the server or the Kubernetes cluster. It is essential to know from time to time if the application has any faults or if the resources in the environment it is running on are enough for the application or if there is an imminent failure about to happen on the application. One open-source solution that can deliver this is Prometheus.
What is Prometheus
Prometheus is a powerful, open-source tool used to monitor systems and applications. It’s particularly well-regarded because it is both reliable and flexible, making it a great choice for monitoring a wide range of environments, especially in cloud-based infrastructure where things can change rapidly.
Prometheus can handle both traditional and modern, dynamic systems, scaling well from small setups to massive, complex deployments. It has become a favorite in the tech world because it’s so good at what it does.
At its core, Prometheus is all about gathering and storing metrics—pieces of data that tell you how things are performing. It regularly collects information from various “endpoints” or sources, like servers, databases, applications, or even hardware. These metrics could include anything from CPU usage to memory consumption, the number of active users, or how long it takes for a website to respond.
By collecting this data over time, Prometheus provides a detailed view of how your systems are behaving. The information gathered by Prometheus is stored in a special database optimized for time-series data—data that changes over time and needs to be accessed quickly. This makes it easy to analyze how your systems have behaved in the past, identify trends, and diagnose problems when they occur.
The data can be queried using a powerful language called PromQL (Prometheus Query Language), allowing you to create custom dashboards, analyze patterns, and generate detailed reports. Prometheus isn’t just about collecting data—it’s also about helping you react to that data. With Prometheus, you can set up “alerting rules” that define what’s normal and what’s not. If something goes wrong—like if a server gets too hot or a database stops responding—Prometheus can automatically trigger alerts to notify you or your team. These alerts can be sent to various platforms like Slack, and email, or integrated into other incident management tools.
Core Components of Prometheus
Server
This is the main component. It’s responsible for scraping (collecting) metrics from various targets at regular intervals. These targets could be anything that provides data, like your servers or applications. The server also stores the collected data and makes it accessible for queries and visualizations.
Exporters
Exporters are tools or agents that live on the systems you want to monitor. They gather specific metrics and make them available to Prometheus. There are many pre-built exporters, such as the Node Exporter for basic server metrics (CPU, memory, disk usage) or the Blackbox Exporter for monitoring web endpoints. If needed, you can create your custom exporter to fit your needs.
Pushgateway
Unlike regular monitoring, where Prometheus collects data by pulling it, the Pushgateway allows short-lived or batch jobs to send (or “push”) metrics to Prometheus. It’s useful when the service to be monitored doesn’t run long enough for Prometheus to scrape it.
Alertmanager
This is the component that handles notifications. Prometheus uses it to manage and send alerts when things go wrong. The Alertmanager can group similar alerts, handle silences (when you don’t want to be alerted), and route notifications to channels like Slack, PagerDuty, or Email.
Service Discovery
A key feature for environments where services frequently change, like in Kubernetes. Service Discovery allows Prometheus to find services automatically without you needing to configure them manually. It integrates with platforms like Kubernetes, Docker, AWS, and others, adapting to dynamic infrastructure with minimal effort.
Storage
Prometheus comes with a built-in database optimized for time-series data. It stores collected metrics efficiently, allowing for quick retrieval and analysis. If you need to keep data for a long time, you can integrate Prometheus with external storage systems, called remote storage backends.ConclusionPrometheus is an important part of your infrastructure it helps you to have a clearer view of the internal workings of your application and the infrastructure that runs the application.
Rules
a way to automate monitoring tasks using Prometheus. These rules allow you to set up automatic checks and alerts for your system’s health.
Prometheus UI
A simple graphical user interface that allows you to query the Prometheus storage engine using PromQL (Prometheus Query Language) for data stored in the storage engine.
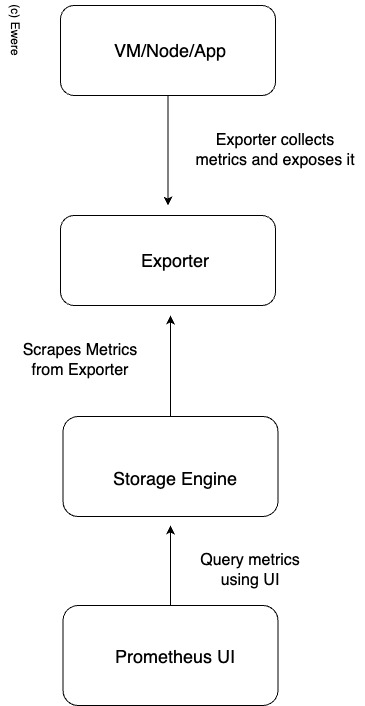
A Basic Prometheus Architecture
How to Setup Prometheus
Prometheus can be set up to run either in a virtual machine as a single binary or in a Kubernetes cluster to collect metrics from various Kubernetes cluster components. As mentioned in the previous core components, the Exporters are the agents that collect specific metrics from the different components of the system, expose the data and the Prometheus configurations scrape the exposed data and write it to the Prometheus storage, and send that data to the Prometheus storage engine, then the data can be queried.
For the setup, we shall focus on the deployment of Prometheus on Kubernetes. The fastest way to deploy Prometheus on Kubernetes is to use a Helm Chart, and more specifically, the kube-prometheus-stack: https://artifacthub.io/packages/helm/prometheus-community/kube-prometheus-stack. It not only deploys Prometheus but also a lot of Prometheus Rules, which are very essential for the AlertManager feature to know the essential components to alert on.
Pre-requisites
- A running Kubernetes Cluster (local or remote)
- Helm Binary installed from the official Helm website (https://helm.sh)
Run the following command on the CLI to add the helm repo:
helm repo add prometheus-community https://prometheus-community.github.io/helm-charts
Run the following command on the CLI to install Prometheus using the chat:
helm install my-kube-prometheus-stack prometheus-community/kube-prometheus-stack --version 66.2.2
With that command, the following components will be installed automatically in your Kubernetes Cluster
- Prometheus (with Alert Rules)
- AlertManager
- Grafana
Conclusion
Prometheus is an important part of your infrastructure. It helps you to have a clearer view of the internal workings of your application and the infrastructure that runs the application.
It is important to deploy Prometheus immediately after you finish setting up the infrastructure so that you can get a proper view of the infrastructure after deployment.


